

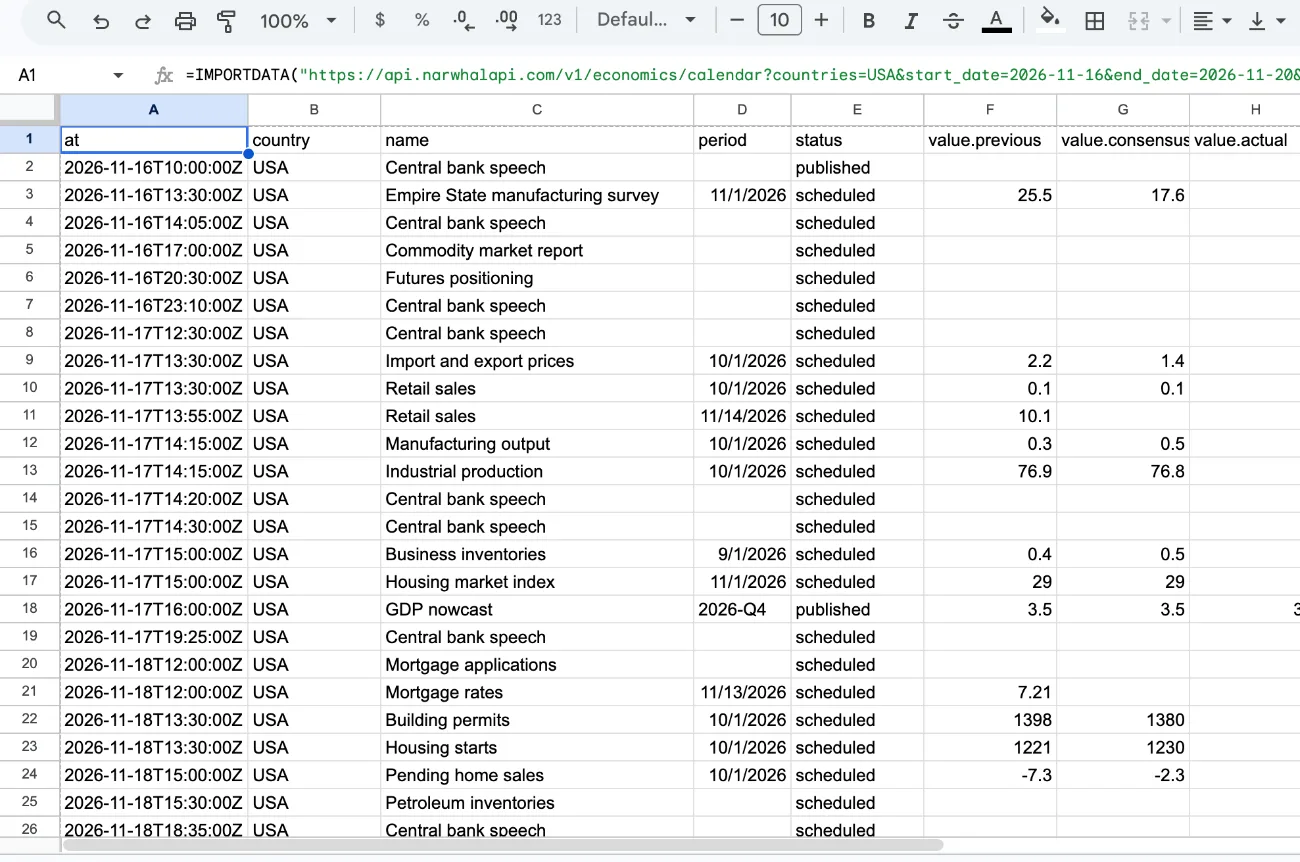
Paste one IMPORTDATA formula and the sheet fills with the week's releases, one row each, sorted by time. The actual figure appears in its column after the release. New here? Create a free account and you get a Sheets key and starting credit to try this.
The formula
=IMPORTDATA("https://api.narwhalapi.com/v1/economics/calendar?countries=USA&start_date=2026-11-16&end_date=2026-11-20&format=csv&key=YOUR_SHEETS_KEY")- Get a Sheets key Create one under Google Sheets keys on Team and keys in your dashboard.
- Put the key in Replace
YOUR_SHEETS_KEYin the formula with your key. - Paste it Click an empty cell in Google Sheets, paste and press Enter. The first time in a spreadsheet, click Allow access.
First rows from 16 Nov 2026:
| at | country | name | period | status | value.previous | value.consensus | value.actual |
|---|---|---|---|---|---|---|---|
| 2026-11-16T10:00:00Z | USA | Central bank speech | scheduled | ||||
| 2026-11-16T13:30:00Z | USA | Empire State manufacturing survey | 2026-11 | scheduled | 25.5 | 17.6 | |
| 2026-11-16T17:00:00Z | USA | Commodity market report | scheduled |
Make it always show this week
Build the dates from today, so you never edit the formula:
=IMPORTDATA("https://api.narwhalapi.com/v1/economics/calendar?countries=USA&start_date=" & TEXT(TODAY()-WEEKDAY(TODAY(),2)+1,"yyyy-mm-dd") & "&end_date=" & TEXT(TODAY()-WEEKDAY(TODAY(),2)+5,"yyyy-mm-dd") & "&format=csv&key=YOUR_SHEETS_KEY")This runs Monday to Friday of the current week. A new week is a new link, so it costs one call on its first load each day.
More than one country
Join codes with a comma:
countries=USA,GBR,JPN,DEURead the columns
| Column | Meaning |
|---|---|
at | Release time in UTC. Empty when only the day is known. |
name | The release. |
period | The month or quarter the figure covers. |
status | scheduled before the release, then its state after. |
value.previous | The last published figure. |
value.consensus | The forecast. |
value.actual | The new figure, filled after the release. |
value_count | How many figures the release has. The row shows the first. |
Useful sheet formulas
Put these in another tab, because the table fills the columns to its right. Here the table's tab is named Calendar. Show the time in your own zone (here New York, UTC minus 5 in winter), then choose Format, Number, Date time:
=DATEVALUE(LEFT(Calendar!A2,10)) + TIMEVALUE(MID(Calendar!A2,12,8)) - 5/24Surprise against the forecast:
=IF(Calendar!H2="","",Calendar!H2-Calendar!G2)Only releases that have a forecast:
=FILTER(Calendar!A2:J, Calendar!G2:G<>"")How often does it refresh?
Google reloads the formula about once an hour while the sheet is open. Reloads of the same link on the same day are free.
Why do some rows have no figures?
Speeches and reports have a time and no number. value_count is 0 for those.
Can I get the calendar in my calendar app as well?
Yes. See Build an economic calendar.
Published .